Drawing a sea wave with equations alone
What was tried
Ran the equations Hamid Naderi Yeganeh published for his Sea Wave image and measured how close the result gets to his original. The equations are written on the artwork itself and no text version could be found, so they were read off the image symbol by symbol and turned into a numpy script that renders 2000×1200 on the original grid. The whole image is one closed-form function with no if anywhere: every condition is a step written as e^(−e^(kx)) with a very large k, the wave is 60 stacked layers with the product ∏(1−J) acting as a z-buffer, and the foam is 17 octaves of cosine noise. The playable version in this entry is a shader that runs the same equations on the GPU of whatever device opens the page: F, how many layers are drawn, the values once suspected of being misread, the step steepness k and the foam octaves can all be changed, and the image and the F(x) chart follow. The original is his work and is not reproduced here; every image in this entry is drawn from these equations.
 ROUND 01Dropped
F read literally — the whole image collapses to 4 colours, almost all white
 ROUND 02Kept
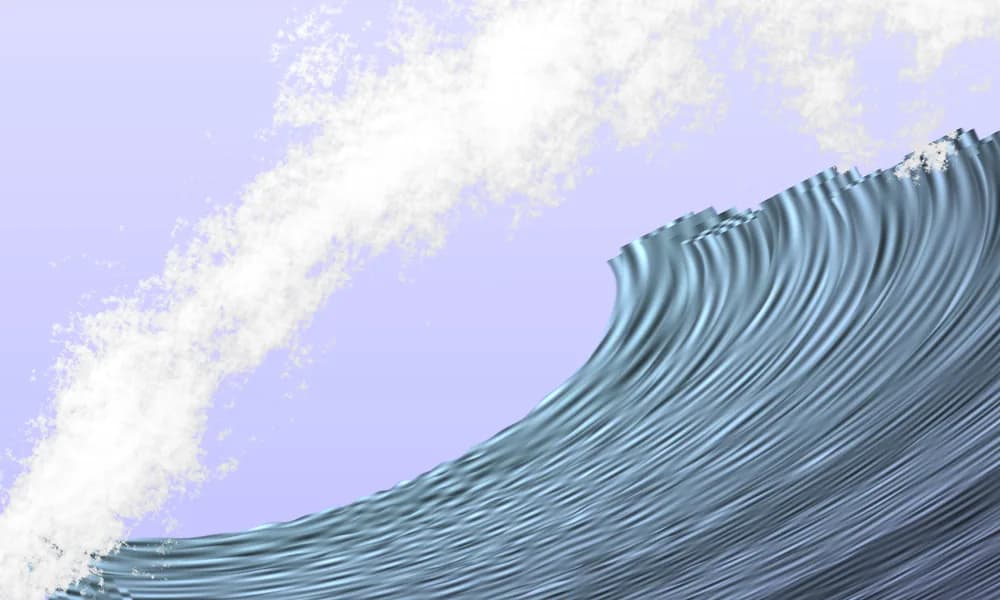
F as clamp(255x) — sky, foam and ripples all appear, but the right edge shows more sky than the original
What was learned
The hardest knot was F(x), the last step that turns a value into a colour. Read literally, it gives a 4-colour image that is almost entirely white: the real H values sit between 0.106 and 1.196, and across nearly all of that range |x|^(e^(1000(x−1))) is about 1, so what the reading dropped is probably a whole e^(−…) layer, not a single minus sign. But the image can only say the literal reading is wrong, not which reading is right: clamp(255x) and wrapping the exponent in one more e^(−…) both give 15,552 colours and differ by at most 1/255 on just 9 pixels, invisible to the eye. Moved onto the GPU, the colours match numpy exactly on 99.65% of pixels at 2000×1200 and differ by at most 1 per channel on the rest (measured on the author's integrated GPU); the float32 GPU needed exponents clamped at ±80 instead of ±700 (e^700 overflows float32), which leaves the steps unchanged.
What fell short
Compared pixel by pixel with the original, 89.6% matches and 10.4% does not (mean colour difference 28 out of 765). Sky covers 32.3% of the original and 41.4% of the render; the left edge is nearly exact (strip x 0–250: 64.2% in the original, 64.6% rendered) but the right edge drifts (strip x 1750–2000: 2.3% vs 16.7%), because on the positive-x side |U_s| grows toward 1, C_s settles near 3, 400·C_s lands near 1200, well outside ±40 of 560 − 8s, and no wave layer attaches there. Three hypotheses that the equations were misread were tested: swapping U and V (worse), moving the 400 multiplier on C_s across 150–500, and moving the ±40 threshold across 40–120. All three failed. If there is a misreading, it has not been found, and the constants were not bent to make the picture closer: this entry measures the published equations, it does not fit the image.