Every star in this sky is something that's here
253 chapters from 20 handbooks, plus experiments, essays and projects — on Tayakorn's desk.
Scroll to fly in · point at any star
20 star systems · 11 nebulae · 5 comets · 16 stations — and still going
Latest on the desk
 ExperimentLAB.11
Continues LAB.07
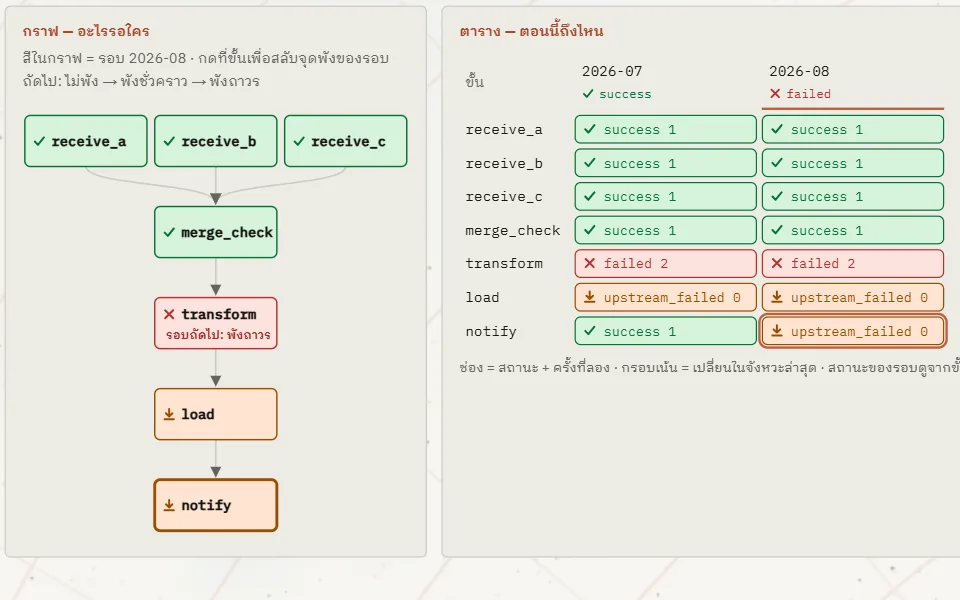
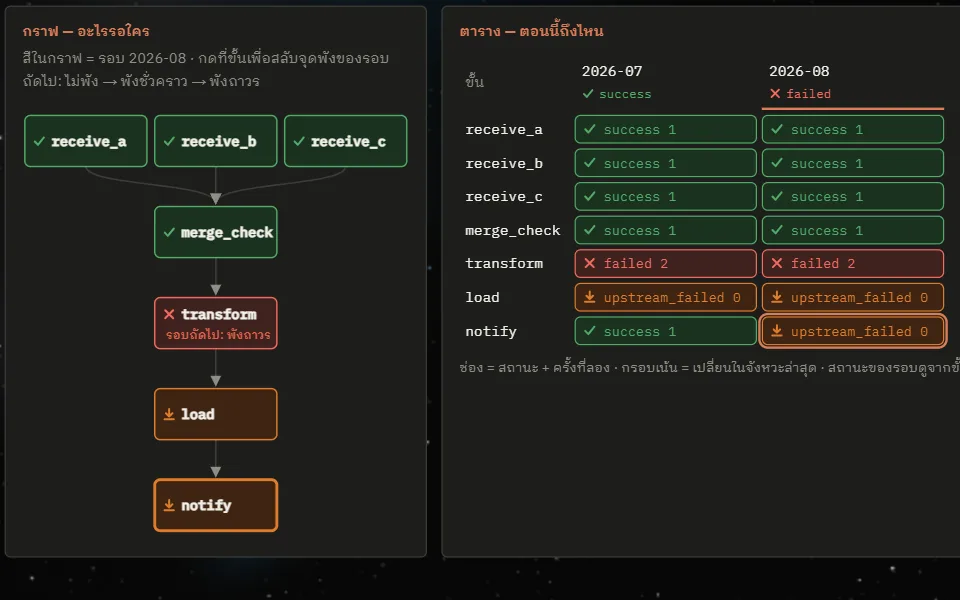
How a DAG flows — when a pipeline breaks halfway, which steps run again
A playable orchestrator built alongside the Airflow handbook. A seven-step monthly file pipeline (receive three branch files, merge and check, transform, load, notify) is drawn as two views of the same state side by side: a graph that says what waits for what, and a table that says where things stand (rows are steps, columns are runs, each cell holds a state and a try number). Tap a step in the graph to make the next run fail there transiently or permanently, set retries from 0 to 3, choose whether notify runs when its upstream succeeds or merely finishes, and choose whether load writes to the destination by appending (append) or by replacing the whole month (replace_month); then step the loop one tick at a time, start new runs to add columns, open a cell to see its tries one by one, or Clear it — after guessing which cells will be reset, and choosing whether to rerun only that cell and its downstream, as an orchestrator does, or the whole thing, as a single script does. Under the table a "warehouse rows" line counts each month's rows, using the numbers from the stock_load.py example in chapter 12. All of the logic is the model from chapter 4 of the book; no Airflow runs on the web.
- Data16 chaptersคู่มือ Airflow — ทำไมงานหลายขั้นต้องมีคนคุมลำดับHandbook
16 chapters
คู่มือ Airflow — ทำไมงานหลายขั้นต้องมีคนคุมลำดับ
งานหลายขั้นพังกลางทางได้เสมอ — จากสคริปต์ที่ต้องรันใหม่ทั้งก้อน ถึงท่อ Airflow 3 ที่รันต่อจากจุดพังได้และรันซ้ำแล้วข้อมูลไม่เบิ้ล
 ExperimentLAB.09
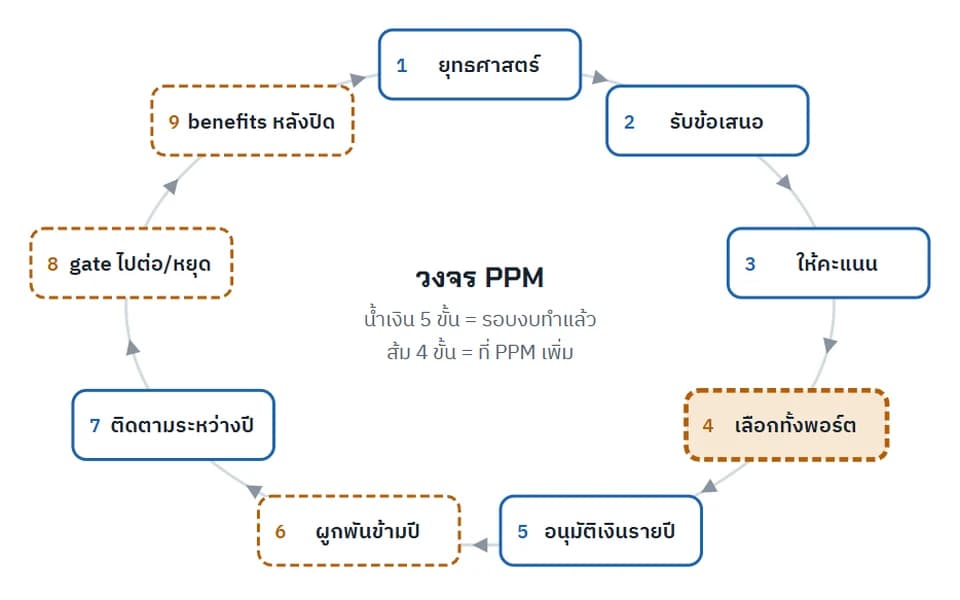
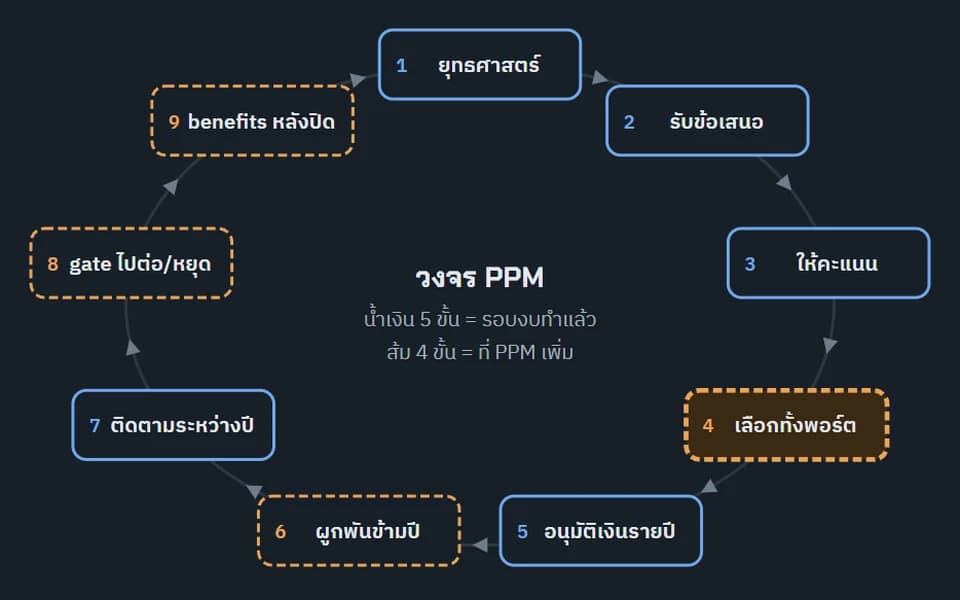
Turning a research report into one playable page — PPM and the budget system
Distilled a deep-research report on Project Portfolio Management and budgeting (about 50,000 characters, six tables, one diagram) into a single page that teaches with pictures, using the visual-explainer widget kit originally built for a project-management course. The page has a tappable nine-step PPM cycle showing which steps an annual budget round already covers, a stepper for two-layer multi-year funding, a budget cut-line simulator comparing rank-by-score against the best set under the ceiling, New Zealand's value × risk approval grid, a map of Thailand's national systems, a data model you can open box by box, and a helper for deciding whether to embed PPM in the existing budget system or run it separately.
 ExperimentLAB.10
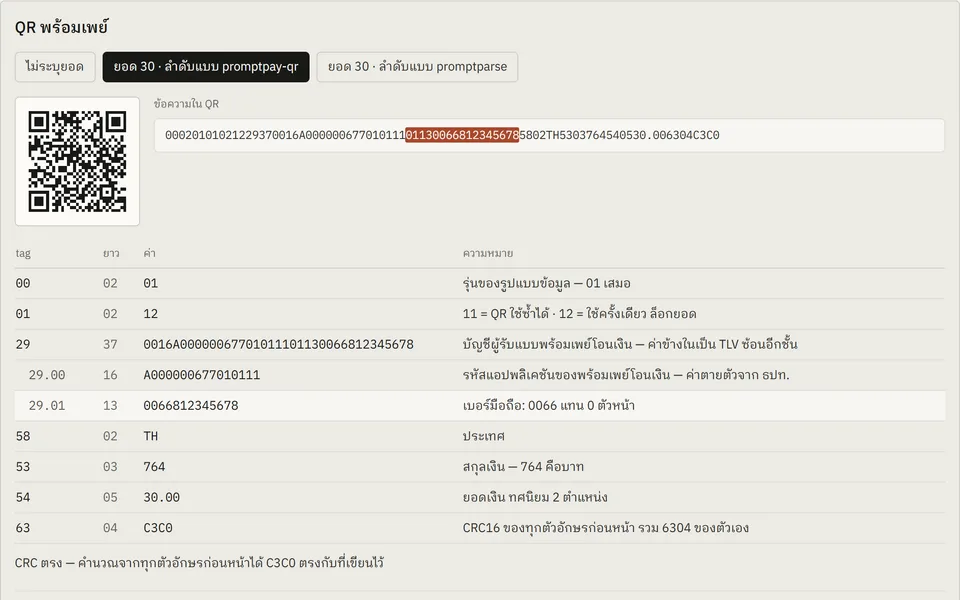
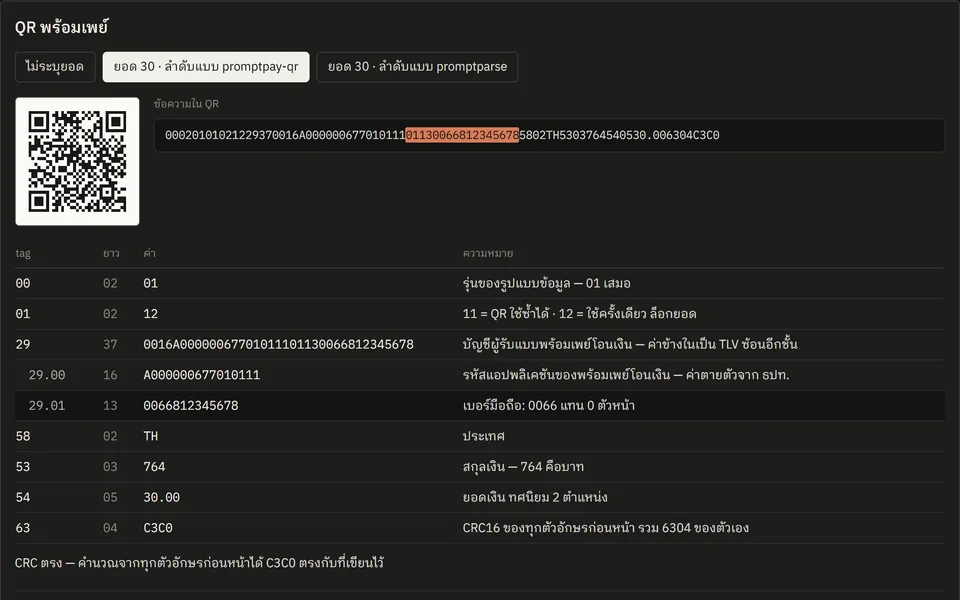
Inside a PromptPay QR, and the slip QR that carries no amount
Built the PromptPay QR for the /support page end to end, to the Thai QR Payment standard and with no payment gateway, then took it apart field by field in this entry. The text inside the QR is a run of TLV fields (a 2-digit tag, a 2-digit length, then the value) closed by a CRC16. The table splits the test samples into rows; pointing at a row shows where that field sits in the string, and the string itself can be edited. The second half does the same for the small QR in the corner of a transfer slip: a slip image of your own can be decoded on the device, and only the text inside its QR is sent to the server for a check.
- AI9 chaptersAI Agent Handbook — มอบงานให้ agentHandbook
9 chapters
AI Agent Handbook — มอบงานให้ agent
เลิกใช้ AI เป็นที่ถาม แล้วมอบงานให้ agent ลงมือแบบที่ตรวจรับเป็น — บรีฟ สิทธิ์ บริบทถาวร หลักฐาน ใช้ได้ทั้ง Claude Code · Cowork · Codex
 ExperimentLAB.08
Continues LAB.06
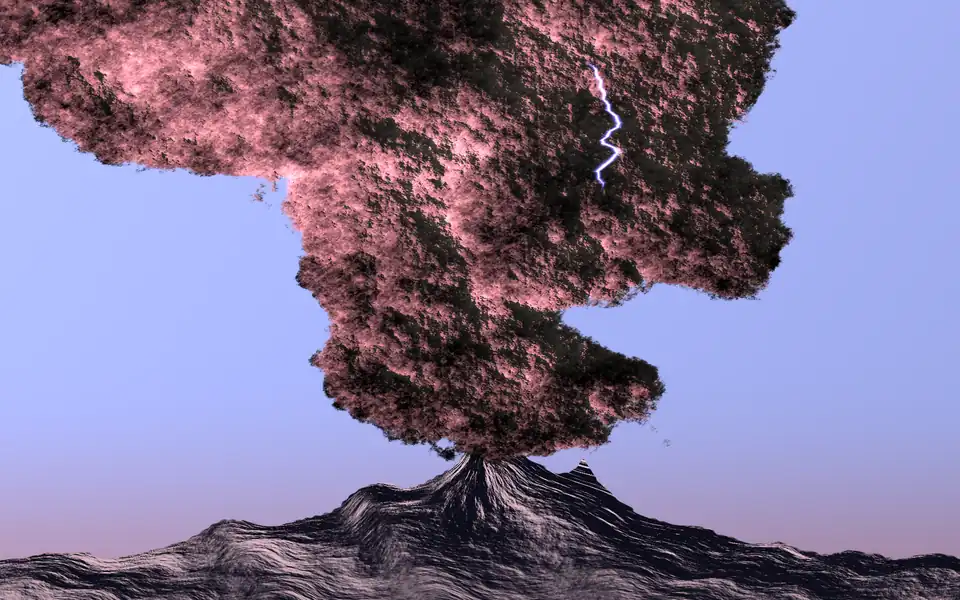
Drawing an active volcano with equations alone
Ran the equations Hamid Naderi Yeganeh published for his Active Volcano image and measured how close the result gets to his original, following LAB.06, which did the same with his Sea Wave. The equations are written on the artwork itself, so they were read off line by line under magnification and turned into a numpy script that renders 2000×1200 on the original grid. A pixel's colour is the sum of four terms — sky, mountain, lightning and cloud — and the cloud's texture and the pattern on the mountain come from sums of 50 layers of cosine waves. The playable version in this entry is a shader that runs the same equations on the GPU of whatever device opens the page: each term can be switched off, the difference that produces the shading can be turned and stretched, the steepness of the shading step can be changed, and the sums can be cut short. The original is his work and is not reproduced here; every image in this entry is drawn from these equations.
 ExperimentLAB.07
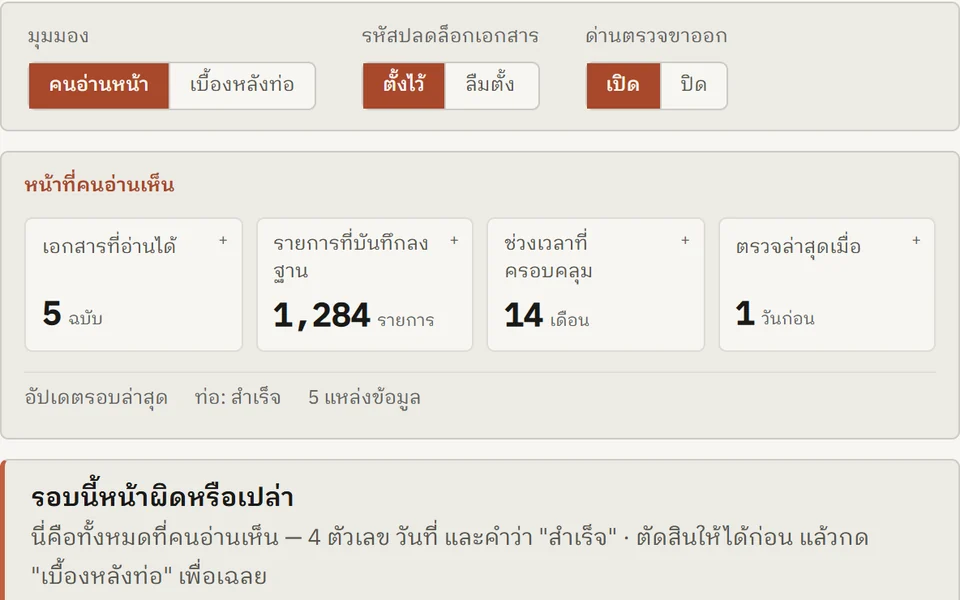
The gate at the exit — how a green build still ships a wrong page
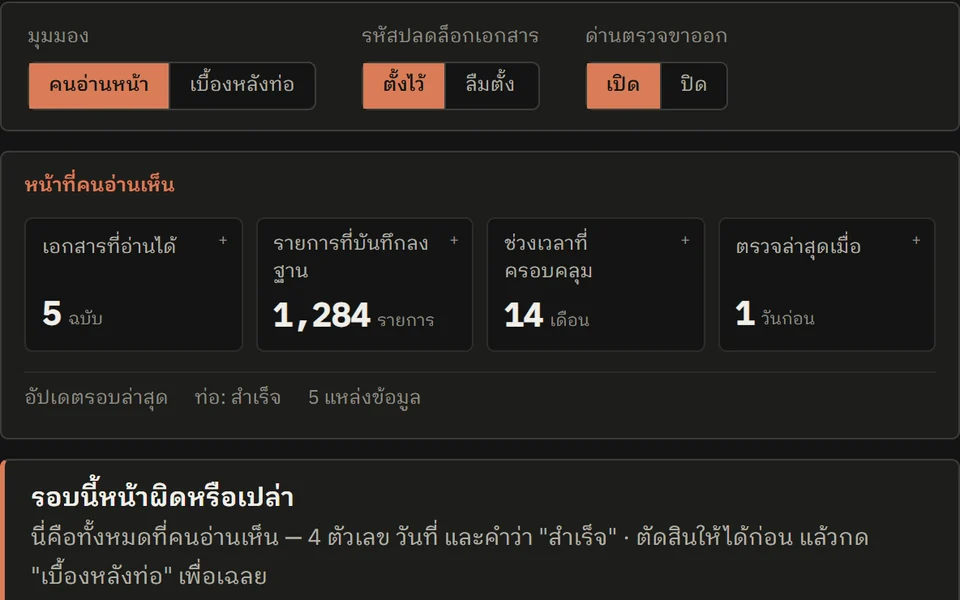
A pipeline simulation with a document-unlock step that asks the reader to judge, from the published page alone, whether that run is wrong — before revealing what happened underneath. Three switches (view, unlock password, exit gate) give four comparable states, and each number can be opened to walk its provenance back to the source documents.
“ตัวเลขบนหน้าจอที่ไม่มีใครตามไปแก้ ไม่ใช่ข้อมูล มันคือของประดับที่เคยเป็นข้อมูล”
Essayเขียนกฎข้อเดียวกันสองครั้ง ในงานที่ไม่รู้จักกัน
เว็บส่วนตัวกับท่อข้อมูลการเงินไม่มีอะไรเกี่ยวข้องกันเลย แต่ทั้งคู่ลงเอยที่กฎข้อเดียวกัน — ห้ามพิมพ์ตัวเลขลงไปตรง ๆ
- ExperimentLAB.11
Continues LAB.07
How a DAG flows — when a pipeline breaks halfway, which steps run again
A playable orchestrator built alongside the Airflow handbook. A seven-step monthly file pipeline (receive three branch files, merge and check, transform, load, notify) is drawn as two views of the same state side by side: a graph that says what waits for what, and a table that says where things stand (rows are steps, columns are runs, each cell holds a state and a try number). Tap a step in the graph to make the next run fail there transiently or permanently, set retries from 0 to 3, choose whether notify runs when its upstream succeeds or merely finishes, and choose whether load writes to the destination by appending (append) or by replacing the whole month (replace_month); then step the loop one tick at a time, start new runs to add columns, open a cell to see its tries one by one, or Clear it — after guessing which cells will be reset, and choosing whether to rerun only that cell and its downstream, as an orchestrator does, or the whole thing, as a single script does. Under the table a "warehouse rows" line counts each month's rows, using the numbers from the stock_load.py example in chapter 12. All of the logic is the model from chapter 4 of the book; no Airflow runs on the web.
- ExperimentLAB.09
Turning a research report into one playable page — PPM and the budget system
Distilled a deep-research report on Project Portfolio Management and budgeting (about 50,000 characters, six tables, one diagram) into a single page that teaches with pictures, using the visual-explainer widget kit originally built for a project-management course. The page has a tappable nine-step PPM cycle showing which steps an annual budget round already covers, a stepper for two-layer multi-year funding, a budget cut-line simulator comparing rank-by-score against the best set under the ceiling, New Zealand's value × risk approval grid, a map of Thailand's national systems, a data model you can open box by box, and a helper for deciding whether to embed PPM in the existing budget system or run it separately.
- ExperimentLAB.10
Inside a PromptPay QR, and the slip QR that carries no amount
Built the PromptPay QR for the /support page end to end, to the Thai QR Payment standard and with no payment gateway, then took it apart field by field in this entry. The text inside the QR is a run of TLV fields (a 2-digit tag, a 2-digit length, then the value) closed by a CRC16. The table splits the test samples into rows; pointing at a row shows where that field sits in the string, and the string itself can be edited. The second half does the same for the small QR in the corner of a transfer slip: a slip image of your own can be decoded on the device, and only the text inside its QR is sent to the server for a check.
- ExperimentLAB.08
Continues LAB.06
Drawing an active volcano with equations alone
Ran the equations Hamid Naderi Yeganeh published for his Active Volcano image and measured how close the result gets to his original, following LAB.06, which did the same with his Sea Wave. The equations are written on the artwork itself, so they were read off line by line under magnification and turned into a numpy script that renders 2000×1200 on the original grid. A pixel's colour is the sum of four terms — sky, mountain, lightning and cloud — and the cloud's texture and the pattern on the mountain come from sums of 50 layers of cosine waves. The playable version in this entry is a shader that runs the same equations on the GPU of whatever device opens the page: each term can be switched off, the difference that produces the shading can be turned and stretched, the steepness of the shading step can be changed, and the sums can be cut short. The original is his work and is not reproduced here; every image in this entry is drawn from these equations.
- ExperimentLAB.07
The gate at the exit — how a green build still ships a wrong page
A pipeline simulation with a document-unlock step that asks the reader to judge, from the published page alone, whether that run is wrong — before revealing what happened underneath. Three switches (view, unlock password, exit gate) give four comparable states, and each number can be opened to walk its provenance back to the source documents.
 ExperimentLAB.05
Continues LAB.04
The chapter viewport — a Blender-style 3D window around a cloud of real chapters
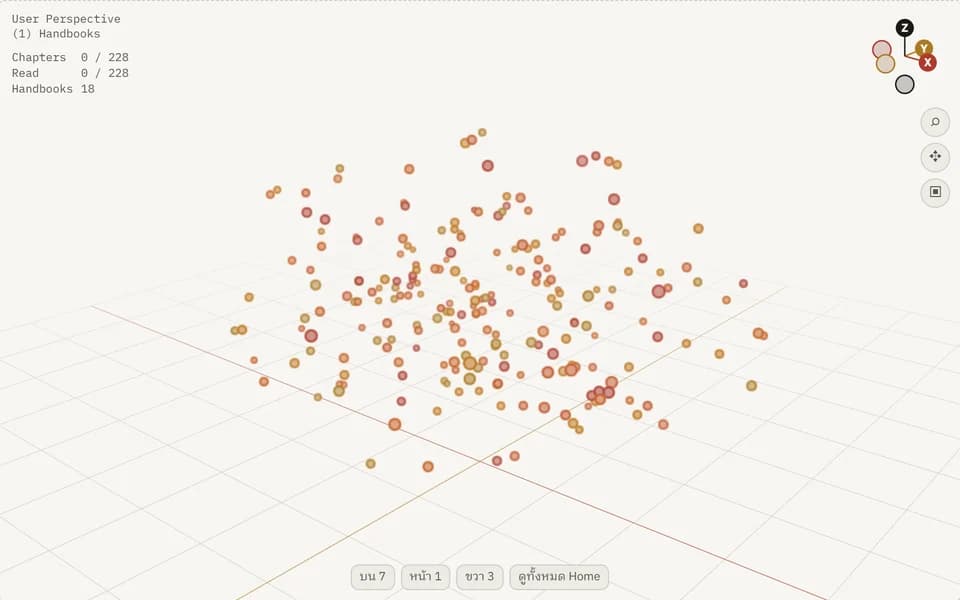
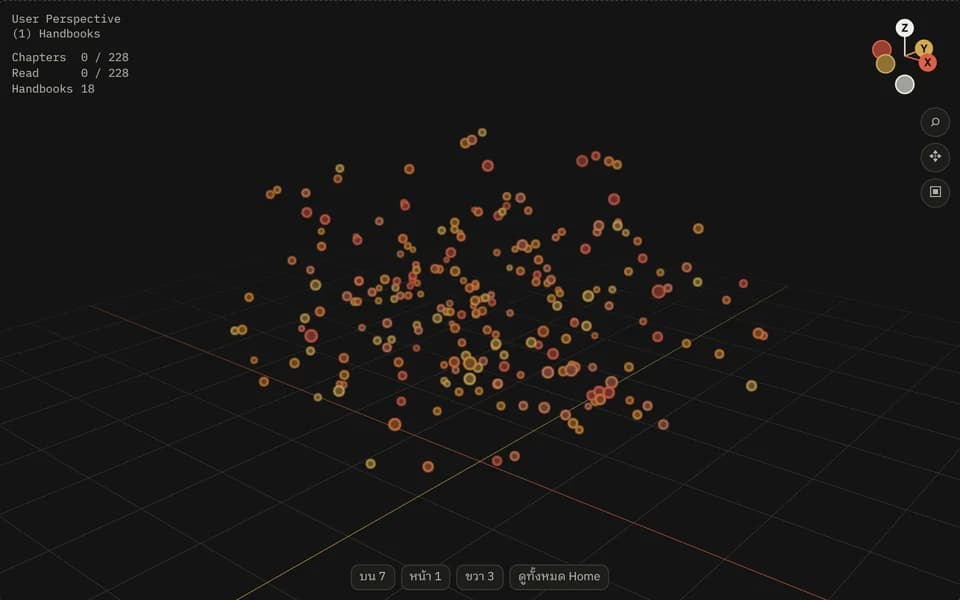
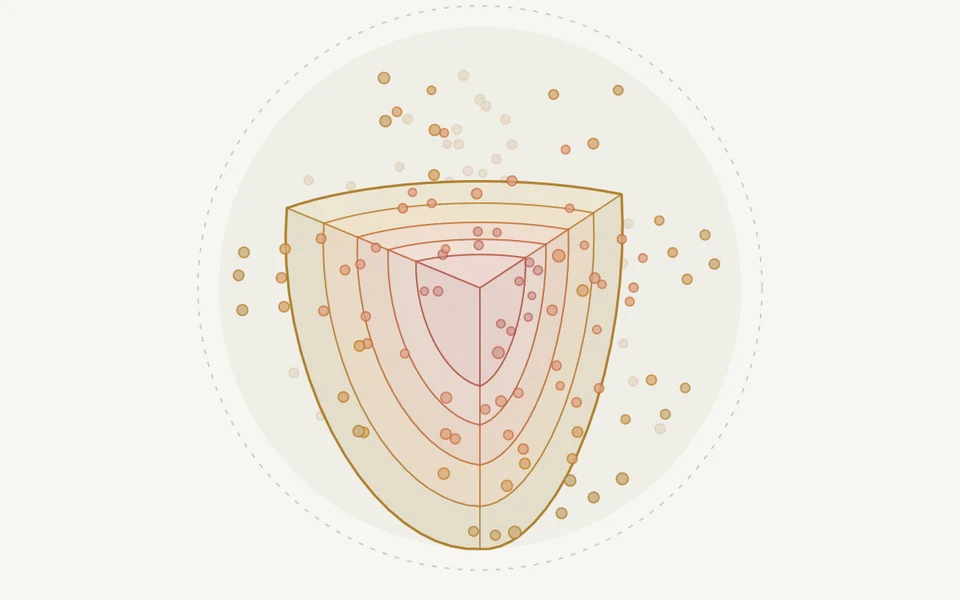
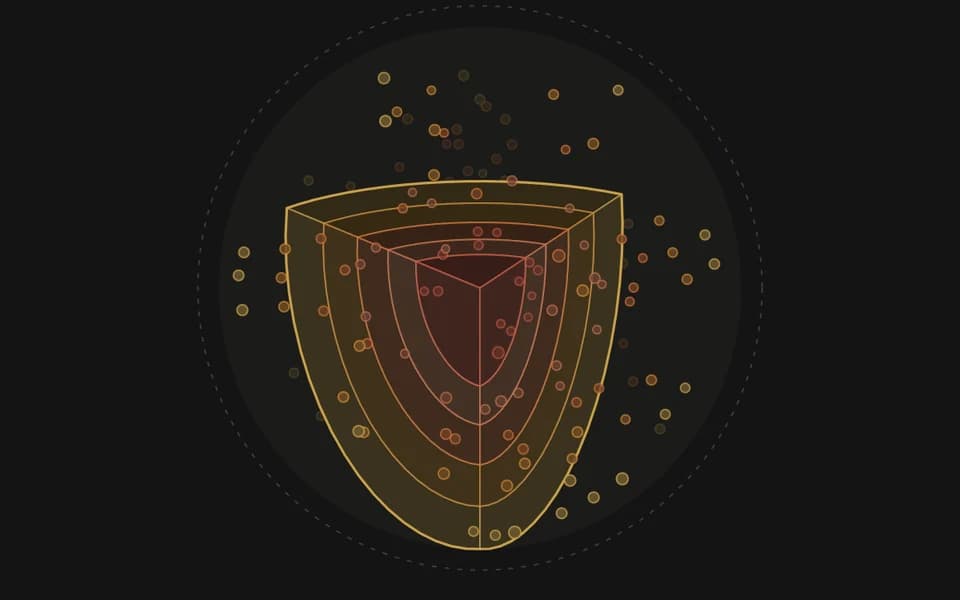
Rebuilt the chapter globe in the language of a 3D window: a Blender-style viewport frame (orbit/pan/zoom camera, preset views, gizmo, major/minor grid, Text Info and Statistics overlays, an Item panel, Blender 5.2's keymap) wrapped around a cloud of real chapters. One dot is one chapter; its place in the cloud is seeded from book and chapter number and deliberately means nothing, while colour, size and opacity carry the data. Drawn with three.js, loaded only when this entry scrolls near the screen; a server-rendered top-view SVG is the first WebGL frame and the fallback when WebGL is unavailable.
 ExperimentLAB.06
Drawing a sea wave with equations alone
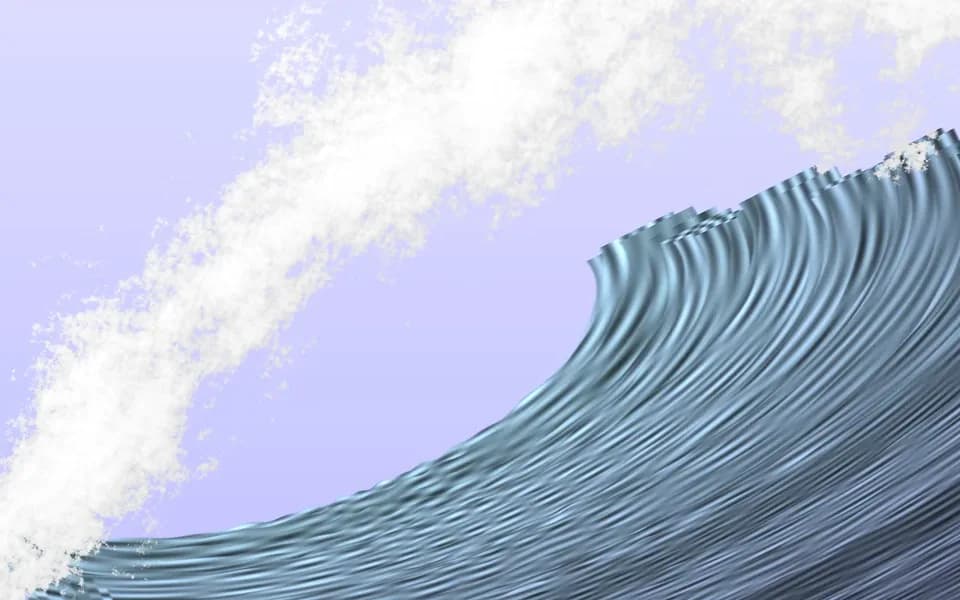
Ran the equations Hamid Naderi Yeganeh published for his Sea Wave image and measured how close the result gets to his original. The equations are written on the artwork itself and no text version could be found, so they were read off the image symbol by symbol and turned into a numpy script that renders 2000×1200 on the original grid. The whole image is one closed-form function with no if anywhere: every condition is a step written as e^(−e^(kx)) with a very large k, the wave is 60 stacked layers with the product ∏(1−J) acting as a z-buffer, and the foam is 17 octaves of cosine noise. The playable version in this entry is a shader that runs the same equations on the GPU of whatever device opens the page: F, how many layers are drawn, the values once suspected of being misread, the step steepness k and the foam octaves can all be changed, and the image and the F(x) chart follow. The original is his work and is not reproduced here; every image in this entry is drawn from these equations.
 ExperimentLAB.04
Continues LAB.03
The chapter globe, built — round one on the real surfaces
Built the form chosen in LAB.03 and wired it into two real surfaces: the home hero became a cutaway globe (one dot = one of 228 chapters across 18 books, colour = rung, size = chapter length, full ink = read, click a book and the figures panel becomes that book's core sample), and /handbooks became every book's core sample laid side by side above the existing list. The data is counted at build time, not typed in. The real thing is playable in this entry, both forms behind one switch, reading progress from the reader's own device. On 19 Sep 2026 the globe came off the home hero (replaced by the equation-drawn wave from LAB.06); in Oct 2026 the side-by-side core samples left /handbooks too — both forms now live only in this entry.
“ตัวเลขบนหน้าจอที่ไม่มีใครตามไปแก้ ไม่ใช่ข้อมูล มันคือของประดับที่เคยเป็นข้อมูล”
Essayเขียนกฎข้อเดียวกันสองครั้ง ในงานที่ไม่รู้จักกัน
เว็บส่วนตัวกับท่อข้อมูลการเงินไม่มีอะไรเกี่ยวข้องกันเลย แต่ทั้งคู่ลงเอยที่กฎข้อเดียวกัน — ห้ามพิมพ์ตัวเลขลงไปตรง ๆ
“วันที่ 20 สิงหาคม 2569 วอลมาร์ทรายงานงบไตรมาส 2 ที่ชนะประมาณการแทบทุกบรรทัดสำคัญ”
Essayลอกงบไตรมาสออกสามชั้น แล้วราคายังไม่ถูกลงอยู่ดี
วอลมาร์ทรายงานงบเกินคาดทุกบรรทัดแล้วหุ้นร่วง 9% ในวันเดียว — ลำดับการลอกที่ทำให้เห็นว่าสองอย่างนี้ไม่ขัดกัน และทำไมลอกครบแล้วยังตอบไม่ได้ว่าราคาคุ้ม
“ผมชอบ bitcoin แต่วันที่ลงเงินจริง สิ่งที่ผมซื้อกลับไม่ใช่ bitcoin มันคือหุ้น…”
Essayผมชอบ bitcoin เลยไปซื้อหุ้น
เรื่องจริงตอนซื้อ MSTR โดยไม่เปิดดูรายละเอียดสักหน้า — ค่าเรียนของบทเรียนที่ว่าราคากับมูลค่าเป็นคนละตัวกัน
“ตอนนี้มี Claude Code สี่ตัวทำงานให้ผมพร้อมกัน…”
EssayAI สี่ตัวไม่ชนกันเพราะกติกา ไม่ใช่เพราะฉลาด
รัน Claude Code สี่สายพร้อมกันบนโปรเจกต์เดียวแล้วรอด — สิ่งที่ทำให้รอดคือกติกาแบบเดียวกับที่ใช้กับทีมคน ไม่ใช่ความฉลาดของโมเดล
“คู่มือส่วนใหญ่บอกคุณว่า "ทำอะไรบ้าง" ทีละขั้น ของผมเลือกบอกว่า "มันทำงานยังไง"…”
Essayอธิบายกลไก ไม่ใช่ขั้นตอน
ทำไมคู่มือทุกเล่มที่ผมเขียนถึงเริ่มจาก "มันทำงานยังไง" ไม่ใช่ "กด 1-2-3"
- Data16 chaptersคู่มือ Airflow — ทำไมงานหลายขั้นต้องมีคนคุมลำดับHandbook
16 chapters
คู่มือ Airflow — ทำไมงานหลายขั้นต้องมีคนคุมลำดับ
งานหลายขั้นพังกลางทางได้เสมอ — จากสคริปต์ที่ต้องรันใหม่ทั้งก้อน ถึงท่อ Airflow 3 ที่รันต่อจากจุดพังได้และรันซ้ำแล้วข้อมูลไม่เบิ้ล
- AI9 chaptersAI Agent Handbook — มอบงานให้ agentHandbook
9 chapters
AI Agent Handbook — มอบงานให้ agent
เลิกใช้ AI เป็นที่ถาม แล้วมอบงานให้ agent ลงมือแบบที่ตรวจรับเป็น — บรีฟ สิทธิ์ บริบทถาวร หลักฐาน ใช้ได้ทั้ง Claude Code · Cowork · Codex
- Data15 chaptersทำไมตาถึงอ่านกราฟนี้ได้เร็วกว่าHandbook
15 chapters
ทำไมตาถึงอ่านกราฟนี้ได้เร็วกว่า
กราฟที่ดีไม่ได้มาจากรสนิยม แต่มาจากขีดจำกัดของสายตาที่วัดเป็นตัวเลขได้ — จากกลไกการมองเห็นถึงการเลือกช่องทางเข้ารหัส
- Dev15 chaptersคู่มือ Mesh NetworkingHandbook
15 chapters
คู่มือ Mesh Networking
เครือข่ายที่ไม่มีเสาสัญญาณหาเส้นทางกันเองได้ยังไง — จากคลื่นวิทยุถึง routing หลายคลื่น จำลองเองได้ด้วย Python
- Dev14 chaptersคู่มือ Blender AnimationHandbook
14 chapters
คู่มือ Blender Animation
ค่าที่เห็นบนจอมาจากไหน — keyframe, armature, constraint, driver จนถึงลำดับที่ Blender คำนวณหนึ่งเฟรม
- Dev12 chaptersHyperFrames HandbookHandbook
12 chapters
HyperFrames Handbook
ทำวิดีโอจาก HTML ที่แก้ได้เหมือนโค้ด — เข้าใจเฟรมคือฟังก์ชันของเวลาถึงแก่น จนเขียน ตรวจ และเรนเดอร์เองได้ทั้งวงจร
- AI10 chaptersAI Brain — Second BrainHandbook
10 chapters
AI Brain — Second Brain
AI ไม่เคยจำอะไรเลย — สร้างความจำถาวรที่มันค้นเจอและอ่านซ้ำได้ทุกรอบ ครบ 6 ขั้นตอน
- AI14 chaptersContext Engineering HandbookHandbook
14 chapters
Context Engineering Handbook
สิ่งที่โมเดลเห็น มีคนประกอบให้ทั้งหมด — อะไรควรอยู่ในหน้าต่าง เรียงยังไง และอะไรต้องเอาออก
Handbook shelf
See every book →- AI14 chaptersHarness Engineering Handbook
- AI10 chaptersAI Brain — Second Brain
- AI14 chaptersPrompt Engineering Handbook
- AI7 chaptersPrompt Handbook
- Dev15 chaptersGit Handbook
- Dev9 chaptersSystem Design Handbook
- Dev9 chapterstmux on WSL2
- Dev14 chaptersCI/CD Handbook
- PM15 chaptersJIRA Handbook
- Finance14 chaptersBitcoin Handbook
- Finance13 chaptersคู่มือหุ้น — ราคา vs มูลค่า
- Life12 chaptersคู่มือลำดับการกิน
- AI12 chaptersคู่มือ Transformer — ลบทุกอย่าง เหลือแค่กราฟ
- AI14 chaptersContext Engineering Handbook
- Dev12 chaptersHyperFrames Handbook
- Dev14 chaptersคู่มือ Blender Animation
- Dev15 chaptersคู่มือ Mesh Networking
- Data15 chaptersทำไมตาถึงอ่านกราฟนี้ได้เร็วกว่า
- AI9 chaptersAI Agent Handbook — มอบงานให้ agent
- Data16 chaptersคู่มือ Airflow — ทำไมงานหลายขั้นต้องมีคนคุมลำดับ
Start your first book
All handbooks →- Read (this device)
- —ch.