Turning a research report into one playable page — PPM and the budget system
What was tried
Distilled a deep-research report on Project Portfolio Management and budgeting (about 50,000 characters, six tables, one diagram) into a single page that teaches with pictures, using the visual-explainer widget kit originally built for a project-management course. The page has a tappable nine-step PPM cycle showing which steps an annual budget round already covers, a stepper for two-layer multi-year funding, a budget cut-line simulator comparing rank-by-score against the best set under the ceiling, New Zealand's value × risk approval grid, a map of Thailand's national systems, a data model you can open box by box, and a helper for deciding whether to embed PPM in the existing budget system or run it separately.
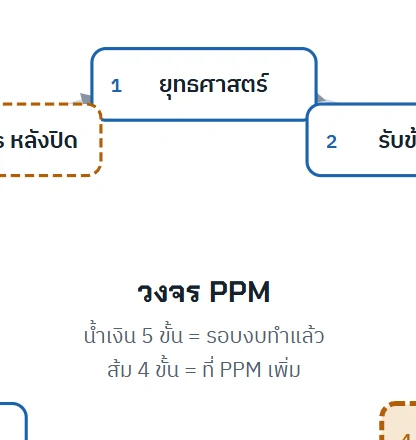 ROUND 01Dropped
First pass — steps 1 and 2 overlap because the ellipse was narrower than the boxes
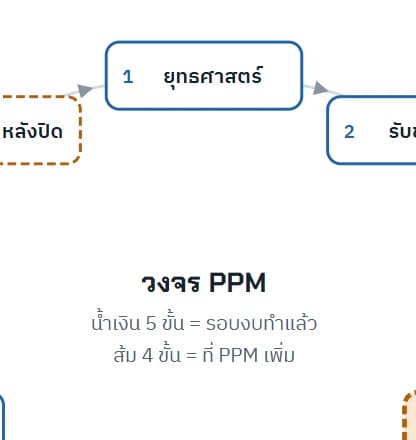 ROUND 02Kept
Wider ellipse, narrower boxes — every step has clearance and the arrows show
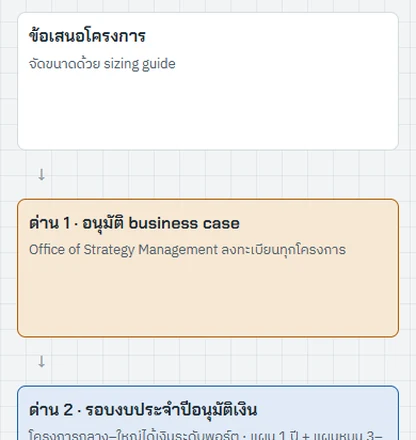 ROUND 03Dropped
At 390 px — boxes balloon because flex-basis 130px becomes height in a column
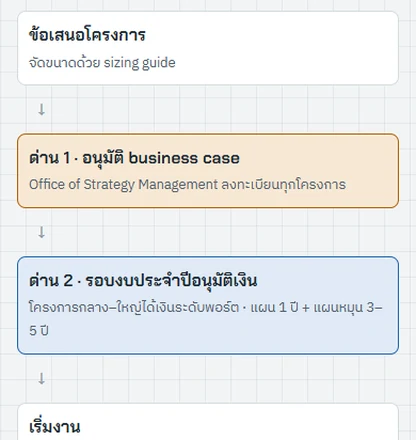 ROUND 04Kept
flex-basis off on narrow screens — boxes fit their text, both gates on one screen
What was learned
A picture that can replace a paragraph needs a mechanism inside it, not just text arranged in boxes. The clearest win was the cut-line simulator: the report could only state that scoring requests one by one is not portfolio selection, while the simulator shows it on its own — raising the ceiling from 20 to 21 units makes rank-by-score lose total value, from 359 to 352, while the best set rises from 362 to 374 (made-up numbers with no currency, checked by script). Second, the bugs only showed up in real screenshots, even though every round passed node --check with no console errors: steps 1 and 2 overlapped in the cycle, a label sat on top of the benefits curve, the two-gate flow ballooned at 390 px because flex-basis turns into height in a column, and pressed buttons in dark mode put white text on light orange.
What fell short
Nobody but the author has used the page, so it is not yet known whether the pictures make the material faster to grasp or merely nicer to look at. Only two spots have check-your-answer exercises (PPM vs project-management tasks, and translating Thai government terms); the other chapters use guess cards and simulators instead, below the kit's own rule that every chapter has an exercise. An LLM fetching the page gets incomplete text, because the cycle descriptions, the data model and the simulators are built by JavaScript and are not in the raw HTML, and there is no .md version yet. Facts come from research notes with sources, some only from search-result summaries without opening the full document, and the page is a snapshot as of 5 Oct 2026 that will not update.